03 October 2019 - Wireless heat maps
Wi-Fi Trek 2019
Gourav Rai, a 2019 ucisa bursary recipient, attended Wi-Fi Trek 2019 in Nashville as his bursary conference. His blogs outline some of the key presentations he saw there and what he learnt as a consequence.
Title : Wireless Design by iBwave
E-Mail : Djamel.ramoul@ibwave.com
Speaker Introduction : Djamel Ramoul, Sales Engineer
Weblink : http://www.ibwave.com/
iBwave Solutions is a telecom radio planning software provider that develops solutions for the in-building wireless industry. iBwave is best known for its software iBwave Design, mostly used by telecom operators, system integrators and equipment vendors.
What makes iBwave different from its competitors is the capability to generate a more accurate 3D modelling algorithm they use to project the wireless network design plans. iBwave uses” Ray Tracing model” for predictive wireless heat maps. The Ray Tracing Model (RT) considers all the paths for transmit (Tx) and receive (Rx) signal before generating is predictive heat maps:
1. Direct path
2. Reflected Path
3. Refracted path
No other wireless heat map predictive model algorithm is as comprehensive as iBwave Ray Tracing Model. Over time iBwave have moved to more evolved Fast Ray Tracing model (FRT) which has added following capabilities:
1. Fast Ray Tracing
2. Limited no. of rays
3. Faster computing time
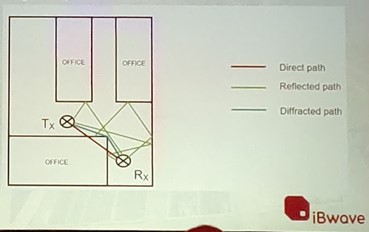
Fig.1 Graphic showing Ray Tracing Model workings
The effects of using the Fast Ray Tracing (FRT) prediction model algorithm has been showcased by means of the graphic below.
Fig.2 Graphic showing Ray Tracing Model application in PC Games
The 3D projection generated by (FRT) are far advanced and can give a more precise co-channel interference (CCI) information when multiple floors are projected together. This can’t be done on a 2D based scanning model. The example below showcases predictive heat maps plans of a stadium. It’s very clear from the graphic that the 2D modelling fails to show the Co-Channel interference in the stadium, but with the iBwave 3D model successfully predicts the CCI once all the floors are considered as one single group.
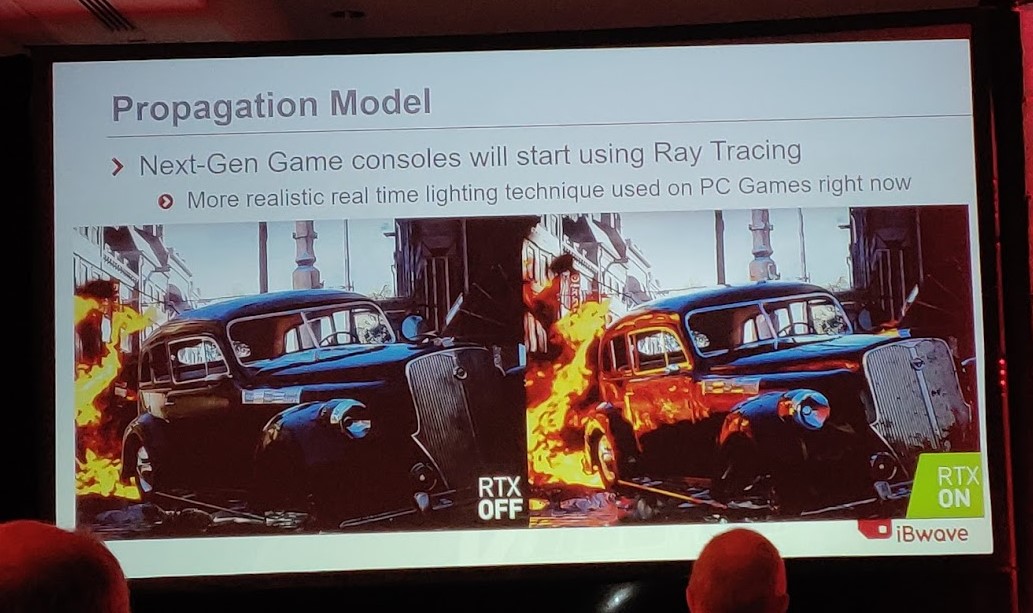
Fig.3 Graphic showing Ray Tracing Model prediction of Co-Channel Interference (CCI)
Moreover, this package has more than 30,000 elements programmed to give an accurate measure of signal propagation and handling.
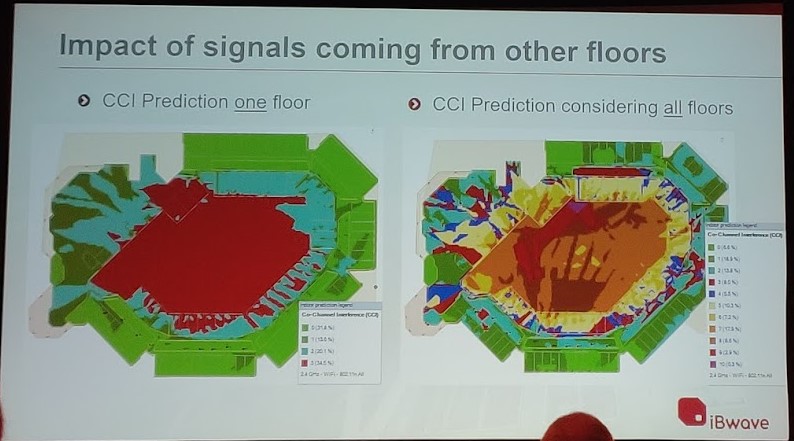
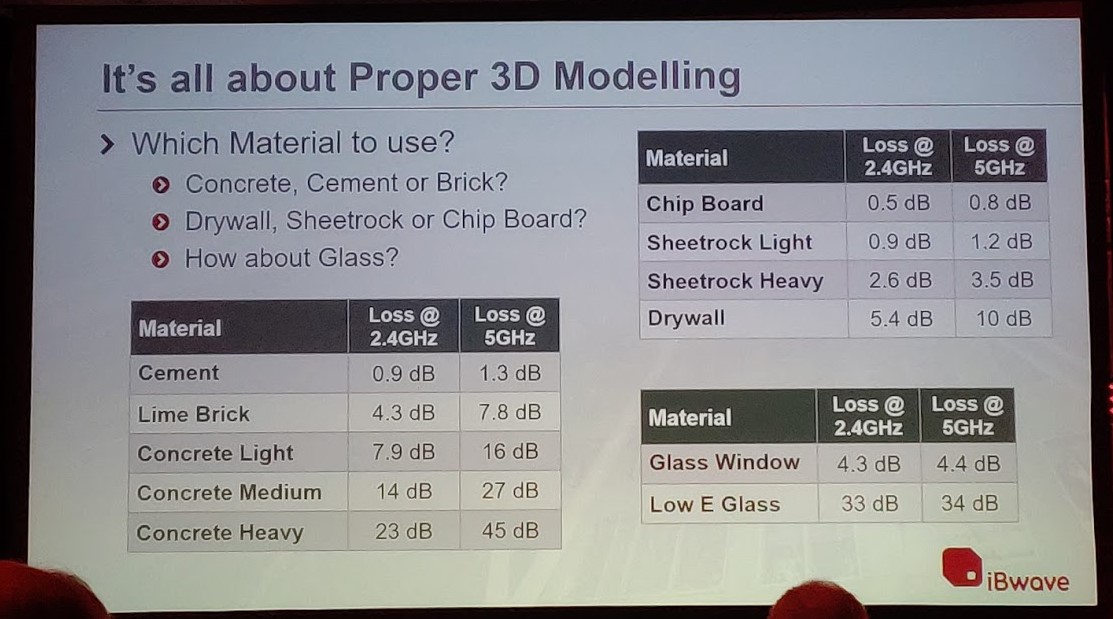
Fig.4 Graphic showing signal loss after propagation through various mediums for 2.4 and 5Ghz frequencies
The package can also help with capabilities to get correct projections. The interpolation of wireless access point coverage patterns is far better in 3D model projection with respect to 2D models. The left-hand side of the slides are showing the marketing material projecting the coverage for a wireless access point. The right-hand side is the actual real coverage experience by the user as monitored by iBwave projection software.
Fig.5 Graphic showing the 2D interpolation of wireless access point antenna pattern
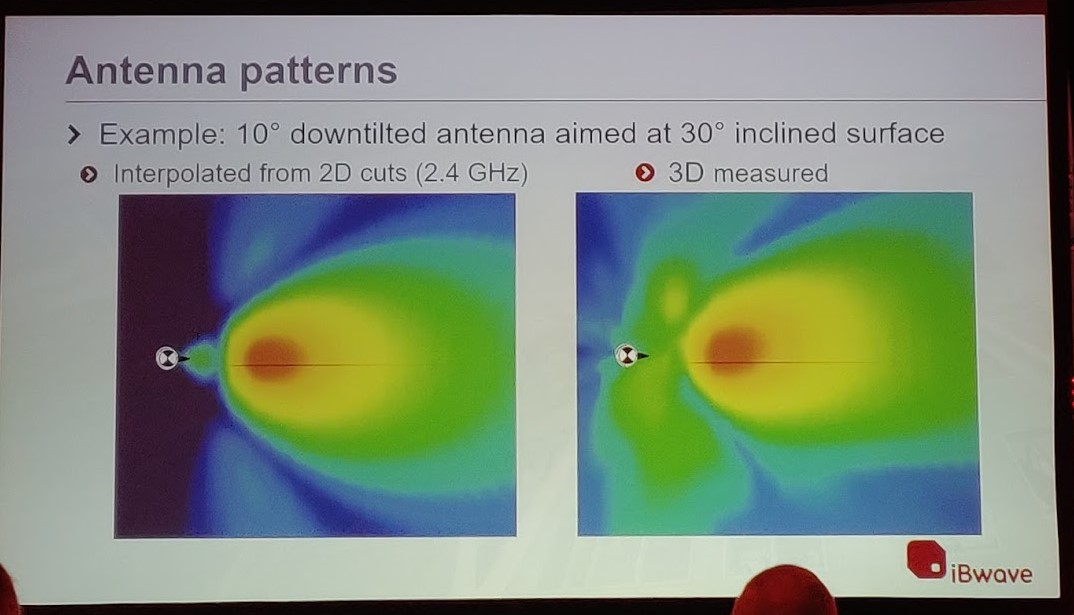
Fig.6 Graphic showing the 2D interpolation of wireless access point antenna pattern
The design and survey software with iBwave also allow simultaneous review of wireless and telecom networks in a building. This a unique package delivering big on various user requirements and helping them to setup, design, deploy and troubleshoot wireless networks with ease. The presentation also had various test cases and demo of few other skills sets of this software package. A software worth consideration!!
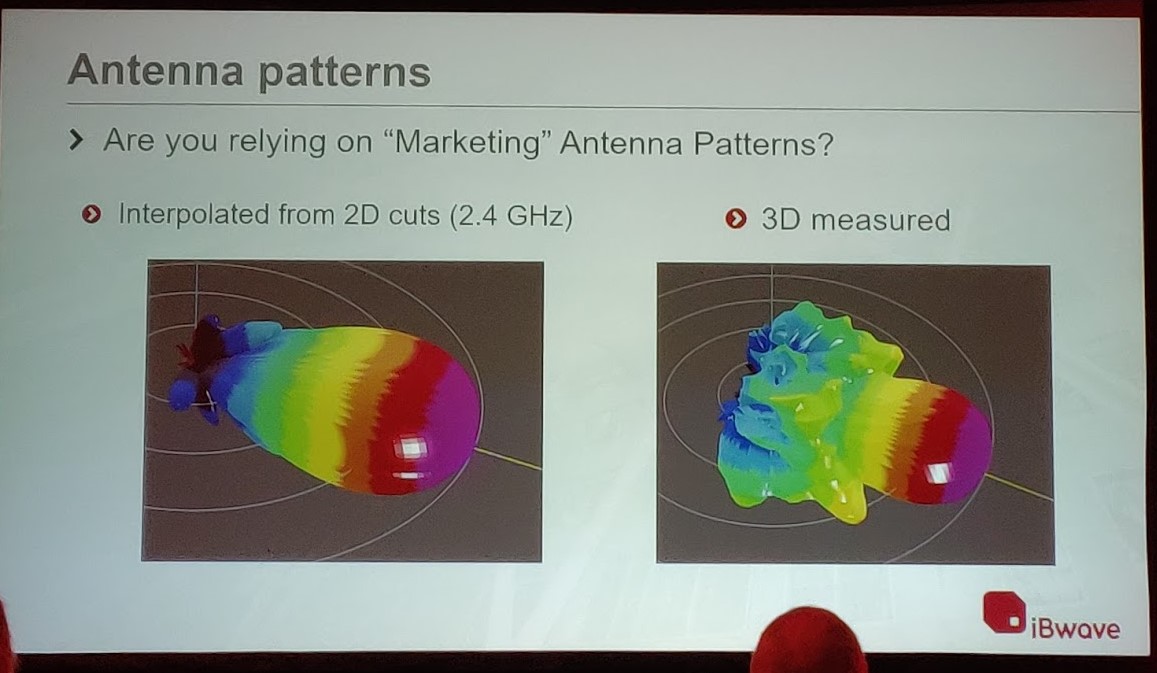
Fig.7 Graphic showing the key slogan with iBwave